Monitoring
Use Monitoring to send telemetry, investigate issues and service health, configure alerts and uptime checks, and read production evidence from your agent.
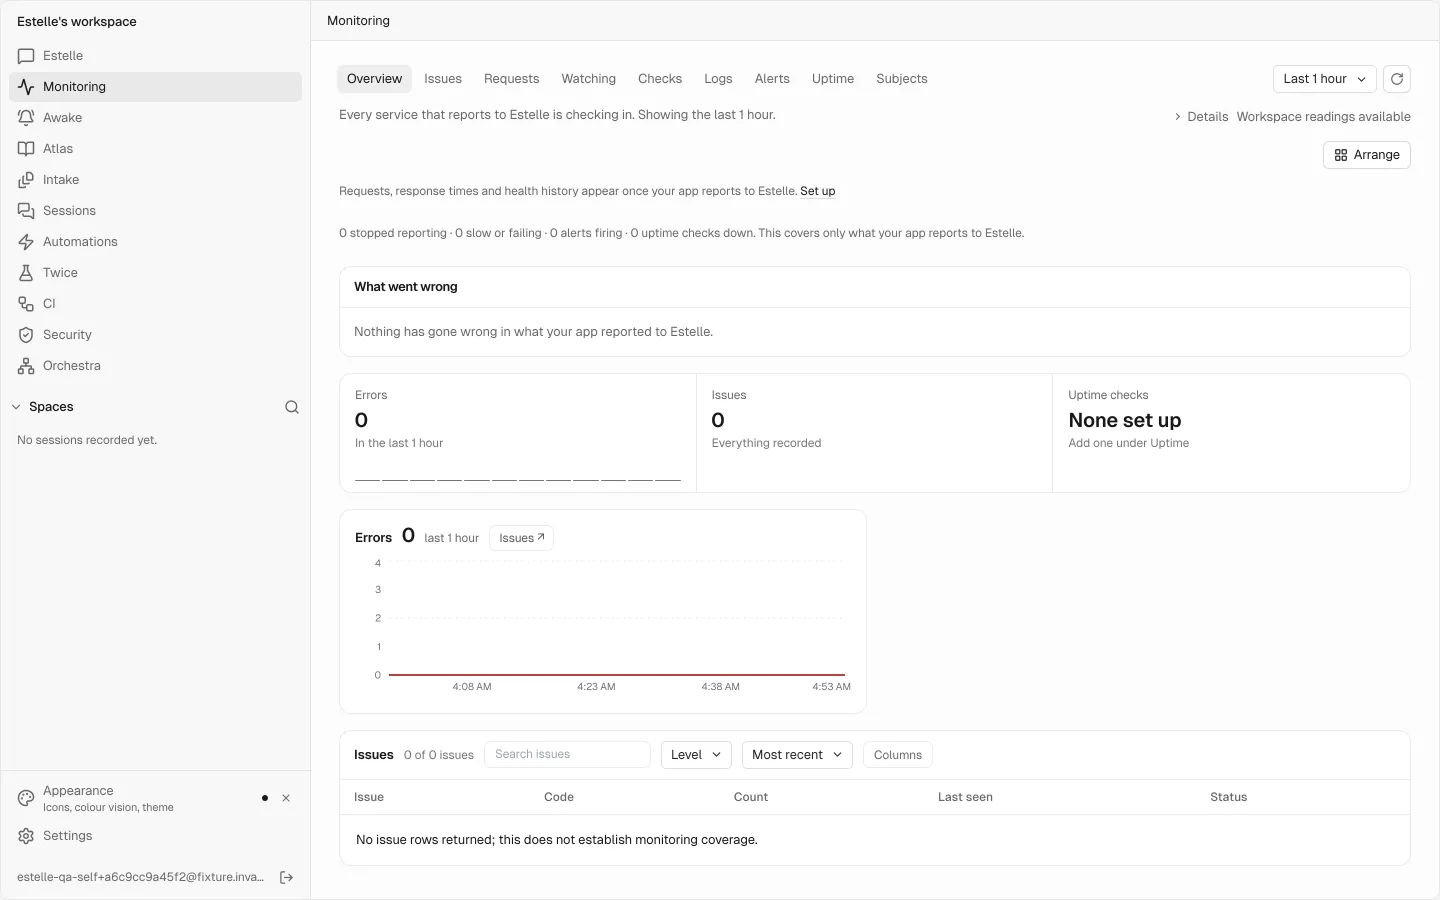
View as MarkdownMonitoring collects your application's errors, logs, traces, and metrics. It groups error events into issues, preserves occurrence and stack evidence, tracks reported service activity, and evaluates alert rules and uptime checks. Use On-call when those signals should open an incident and notify your team.
#When to use Monitoring
Use Monitoring to answer what is breaking in production, when it started, how often it is happening, and which service or code location is involved. It works with existing OpenTelemetry instrumentation and accepts Sentry-shaped error events.
Monitoring is evidence collection and investigation. It does not by itself prove that a service is healthy, that a code link is the root cause, or that a proposed fix is correct.
#Connect your application
Create the right API key
Open Settings → API keys and create a key for your server-side telemetry environment. Requests use
Authorization: Bearer <key>.A
monitoring-onlykey can send telemetry but cannot read it back. Reading through the API or MCP requires a full key or a signed-in dashboard session. Never put a full key in browser code or another place users can read it.Configure telemetry
If your app already exports OpenTelemetry, point its exporter at Estelle. Otherwise, ask your coding agent to run the
estelle-monitor-installplaybook to inspect the app and propose instrumentation that fits its entry points and existing telemetry.Send and read back a test event
Run the app and trigger a controlled error, or post the example below. Then open Monitoring → Issues and confirm that the event arrived. A successful exporter process or HTTP request alone is not enough; the read-back is what shows what Monitoring stored.
For a stock OpenTelemetry SDK or Collector, set:
OTEL_EXPORTER_OTLP_ENDPOINT=https://api.fatelabs.ca
OTEL_EXPORTER_OTLP_HEADERS="authorization=Bearer <your-key>"
The Bearer prefix is required.
#Choose an ingestion format
| Signal | Endpoint | Accepted input |
|---|---|---|
| Traces | https://api.fatelabs.ca/v1/traces | OpenTelemetry over HTTP, JSON or protobuf |
| Logs and metrics through OpenTelemetry | https://api.fatelabs.ca/v1/logs and https://api.fatelabs.ca/v1/metrics | OpenTelemetry over HTTP, JSON or protobuf |
| Errors | https://api.fatelabs.ca/monitor/ingest | A Sentry event, Sentry envelope, or OTLP JSON |
| Log lines | https://api.fatelabs.ca/monitor/logs | OTLP JSON, a JSON array, one JSON object, or newline-delimited JSON |
| Named metric points | https://api.fatelabs.ca/monitor/metric | One {name, value, kind?, ts?} object, a metrics batch, or a list |
To send one controlled error by hand:
curl -X POST https://api.fatelabs.ca/monitor/ingest \
  -H "Authorization: Bearer $ESTELLE_KEY" \
  -H "Content-Type: application/json" \
  -d '{"level":"error","environment":"production","exception":{"values":[{"type":"ValueError","value":"cart total is negative","stacktrace":{"frames":[{"filename":"app/cart.py","function":"total","lineno":42}]}}]}}'
Monitoring retains the exception type, a scrubbed message, and stack-frame locations. It can use those locations to link an issue to your indexed code. Include release information in your normal event payload when you want the issue detail to identify the release.
#Read the Monitoring page
Choose Last 15 minutes, Last 1 hour, Last 3 hours, or Last 24 hours. The opening window is 24 hours. Read the requested and returned interval notes when interpreting charts; an unreported value is not a measured zero. Issue counts cover recorded issues and are not all filtered by the chart window.
| Tab | What to use it for |
|---|---|
| Overview | Measured requests, errors, response times, issues, checks, and current problems. Unmeasured instruments are named rather than drawn as zero. |
| Issues | Grouped errors, occurrence counts, status, recent activity, code links, and fix state. |
| Requests | Request volume and response-time evidence reported by your app. |
| Watching | Services that have reported and services that have gone silent. |
| Checks | The latest state and recent history of uptime checks. |
| Status | Uptime and reporting status over longer periods, plus recorded check incidents. |
| Logs | Search messages, services, or trace IDs and filter by level. |
| Alerts | Configured rules and the rules firing now. |
| Uptime | Manage checks and inspect checker status. |
| Subjects | Enter a customer, account, device, or other subject ID to read its recorded history. |
A silent service means Monitoring stopped hearing from it; silence is not proof that the service stopped or that it is healthy. Similarly, an issue with no code link is still a recorded issue.
#Investigate an issue
Open an issue to inspect its exception type and sample message, occurrence count, first and last seen times, status, release when supplied, recent frequency, and stack trace. When a code link exists, use Open file:line to inspect the source at the linked ref.
Treat the code link as an investigation lead, not a diagnosis. Compare the stack, release, timing, and recent changes before assigning a cause.
Use the status control to Resolve, Ignore, or Reopen an issue. The issue detail also shows fix activity:
- Fix drafted or Pull request ready to review describes available work, not a merged repair.
- Passed Estelle's checks, Blocked by Estelle's checks, and Could not be checked describe the recorded check outcome for that work.
- No safe fix found and Fix attempt failed require human investigation; neither is a resolution.
Open the pull request when one exists, review its diff, and run the relevant tests yourself. A person decides whether to merge.
#Add and interpret alert rules
On Alerts, open Add an alert rule. Enter a name and an Error threshold in one hour, then choose Save to account. The dashboard rule fires when the hourly error-event count reaches that threshold. It is a count, not a percentage.
The Firing now section is the current condition, not a notification-delivery receipt. A threshold rule fires when it enters a breach and resolves when the observed value returns within the threshold. Check On-call for incident and channel-delivery records.
The API also supports:
kind: "metric"withmetric,agg,threshold,comparator, andwindowfor a named metric's window aggregate;kind: "new_issue"withsymbolfor a new issue attached to one code symbol.
Create or update rules with POST /monitor/alert. Include id to update an existing rule. To pause one without deleting it, use POST /monitor/alert/delete with {"id":"...","disable":true}.
#Add and interpret uptime checks
On Uptime, open Add an uptime check, enter a name and an HTTP(S) health URL, then choose Save to account. Dashboard-created checks run every 60 seconds and expect HTTP 200.
A check is up only when its measured response matches the expected status. Down means the latest completed probe failed that expectation. A check with no completed probe is unknown, not up or down. Use Checker status to distinguish a quiet check from a checker that is not running.
The API accepts interval and expected_status when you need a different policy. Use an endpoint that is safe to probe and does not expose private network locations.
#Read production evidence from your agent
A connected coding agent can use these read-only MCP tools:
| Tool | What it returns |
|---|---|
monitor_overview | The production health summary. |
monitor_issues | Recorded issues. |
monitor_issue | One issue with its recent events; pass its key. |
monitor_logs | Log lines, with supported search and filtering. |
monitor_alerts | Alert rules and currently firing rules. |
monitor_uptime | Uptime checks and their measured state. |
Ask a narrow question first, for example “show the newest production issue, its occurrences, and its stack,” then verify the referenced issue in the dashboard before changing code.
#Retention, limits, and cost
Settings → Automatic → Data retention controls team retention from 1 to 3,650 days; the default is 30 days.
| Limit | Value |
|---|---|
| Alert rules | 200 on Free and Pro; 1,000 on Ultra, Max, and Team. A new rule past the cap is refused without deleting existing rules. |
| Uptime checks | 100 per account. |
| Dashboard-created uptime checks | Every 60 seconds, expecting HTTP 200. |
Monitoring is included on every active plan. Ingested events use Estelle Credits. Past the allowance, repeated events can be sampled instead of refused; the first sighting of a new issue is retained. A sampled occurrence count is a lower bound, not the complete traffic count. See Plans and credits.